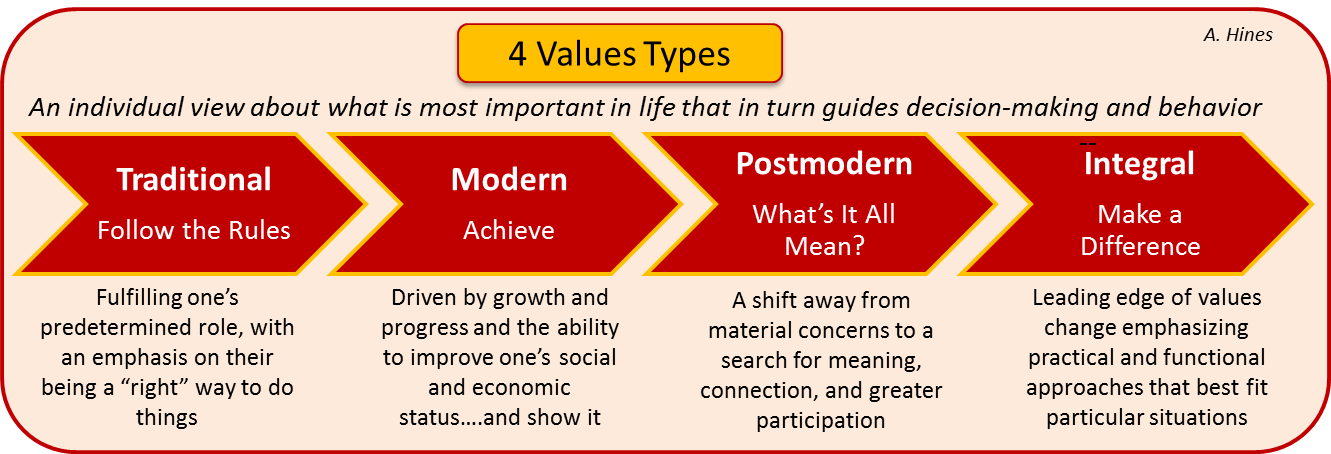
Could no longer avoid the Saturday morning to-do list item: “create summary graphic of values types described in ConsumerShift.” So here it is. I thought readers of this blog might find it useful. I’d welcome feedback — please be kind, design has never been my strong suit. Andy Hines
New Values Types Summary Graphic
Andy Hines
Lecturer/Executive-in-Residence, University of Houston Futures Studies
Andy Hines is Lecturer and Executive-in-Residence at the University of Houston’s Graduate Program in Futures Studies, bringing together the experience he earned as an organizational, consulting, and academic futurist. He co-founded and is currently on the Board of the Association of Professional Futurists, and has co-authored three books -- Thinking About the Future: Guidelines for Strategic Foresight (Social Technologies, 2007),” 2025: Science and Technology Reshapes US and Global Society (Oak Hill, 1997) and Managing Your Future as an Association (ASAE, 1994). He has also authored dozens of articles, speeches, and workshops, including the 2003 Emerald Literati Awards' Outstanding Paper accolade for best article published in Foresight for “An Audit for Organizational Futurists” and the 2008 award for “Scenarios: The State of the Art.” In the last year, he has appeared on several radio and television programs, including KRIV-26 News talking about the future of libraries and the CBS “Early Show,” to talk about an MTV-commissioned study: “The Future of the Youth Happiness.”

Andy,
I think that the left to right strength of this graphic gives a strong sense of progression (Western).
You might consider incorporating the vMeme colors from SD instead of all red for the value arrow fields.
Also, I noodled around a bit with the idea that the relative size of the arrow fields could be used to convey the percent population practicing each value set.
And lastly, what if you were graphically able to convey the overlap of the Integral values backwards into the other value practices? Maybe with a longer lower tail from the Rightmost to the Leftmost (Traditional).
I did get a lot out of the graphic and it is consistent with my understanding of the ‘value stream’.
excellent suggestions, Jim — thanks so much!